Introduction
The Ichimoku Cloud, also known as Ichimoku Kinko Hyo, is a technical analysis indicator that can be used to analyze financial markets. It was developed by Japanese journalist Goichi Hosoda in the late 1930s and is now widely used by traders around the world.
The Ichimoku Cloud consists of five lines and a shaded area that are plotted on a price chart. These lines and the shaded area provide information on trend direction, support and resistance levels, and potential buy and sell signals.
In this article, we will explore how to use the Ichimoku Cloud in USD/JPY trading. We will cover the different components of the Ichimoku Cloud, how to use it to identify trends and support/resistance levels, and trading strategies that can be used with this indicator.
What is Ichimoku Cloud?
The Ichimoku Cloud is a complex technical analysis indicator that is made up of several components, each with its own calculation and significance.
Components of Ichimoku Cloud
- Tenkan-sen (Conversion Line)
- Kijun-sen (Base Line)
- Senkou Span A (Leading Span A)
- Senkou Span B (Leading Span B)
- Chikou Span (Lagging Span)
Each of these components provides important information about trend direction, support and resistance levels, and potential buy and sell signals.
Calculation and Significance
- The Tenkan-sen is calculated as the average of the highest high and lowest low over the past 9 periods. It is often used as a shorter-term trend indicator.
- The Kijun-sen is calculated as the average of the highest high and lowest low over the past 26 periods. It is often used as a longer-term trend indicator.
- The Senkou Span A is calculated as the average of the Tenkan-sen and Kijun-sen, plotted 26 periods ahead. It forms one edge of the Kumo cloud and is often used as a support or resistance level.
- The Senkou Span B is calculated as the average of the highest high and lowest low over the past 52 periods, plotted 26 periods ahead. It forms the other edge of the Kumo cloud and is often used as a strong support or resistance level.
- The Chikou Span is the current closing price, plotted 26 periods back. It is often used to confirm trends and potential buy or sell signals.
By analyzing these components in combination with each other, traders can gain a deeper understanding of market trends and identify potential trading opportunities.
How to use Ichimoku Cloud in USDJPY trading
The Ichimoku Cloud can be a powerful tool for analyzing USDJPY trends and identifying potential trading opportunities. Here are some key ways to use it:
Identifying Trend Direction
The Tenkan-sen and Kijun-sen lines can be used to identify the direction of the trend. When the Tenkan-sen crosses above the Kijun-sen, it may indicate a bullish trend, while a bearish trend can be indicated by the Tenkan-sen crossing below the Kijun-sen.
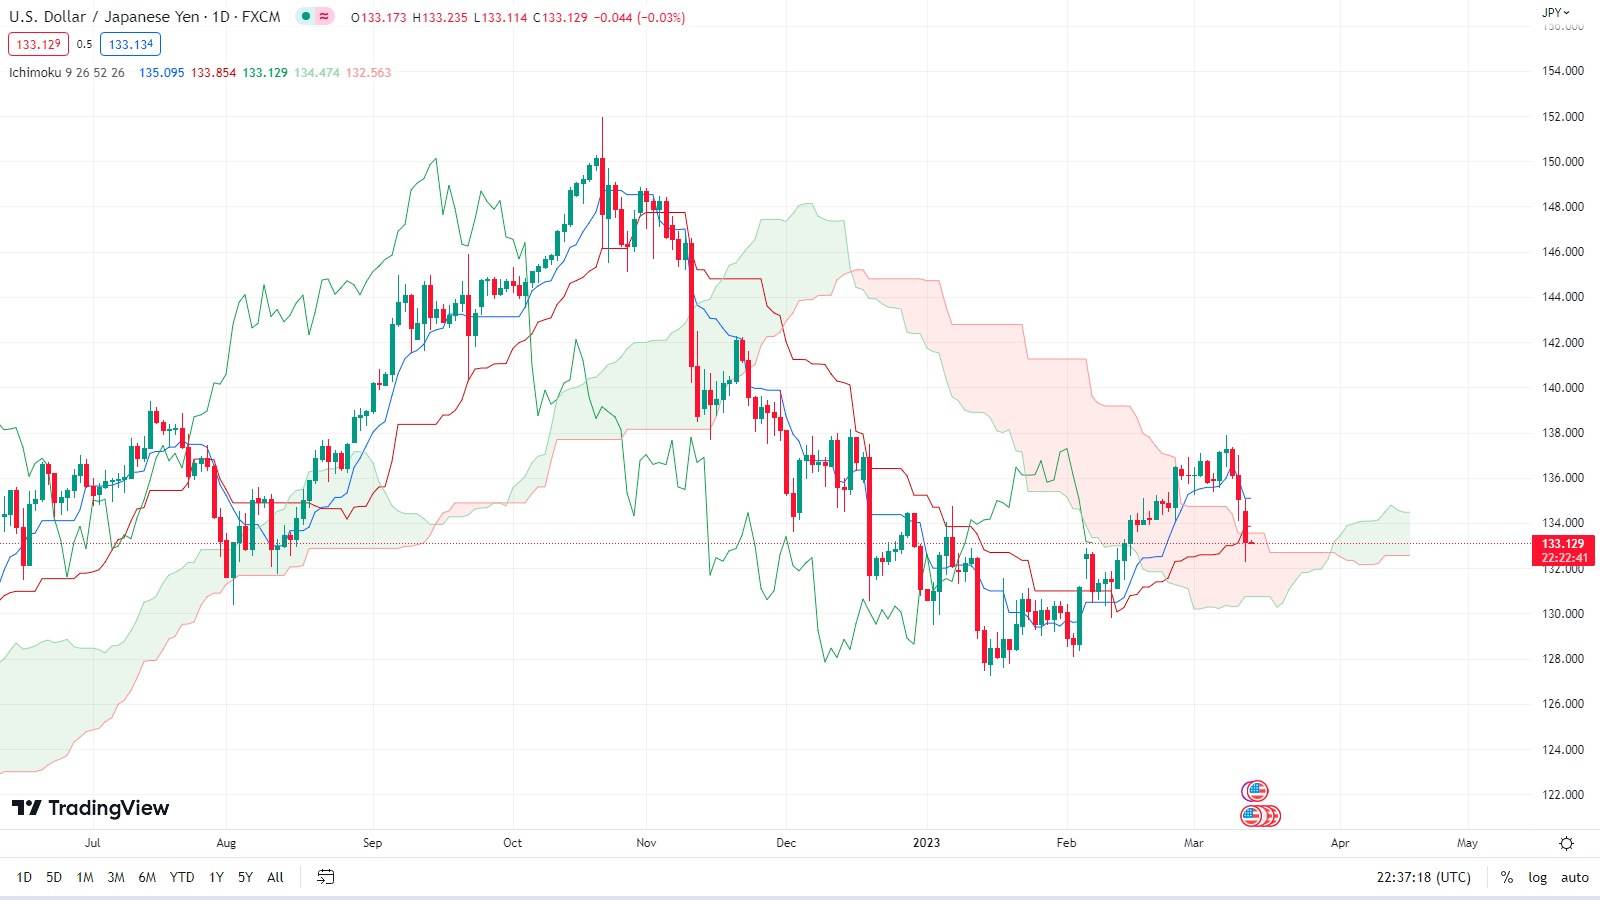
Identifying Support and Resistance Levels
The Kumo cloud formed by the Senkou Span A and B lines can be used to identify support and resistance levels. If the price is trading above the Kumo cloud, it may be considered a bullish signal and the cloud may act as support. Conversely, if the price is trading below the cloud, it may be considered a bearish signal and the cloud may act as resistance.
Identifying Potential Buy/Sell Signals
The Chikou Span can be used to confirm potential buy or sell signals. If the Chikou Span is above the price, it may indicate a bullish trend and potential buying opportunities. If the Chikou Span is below the price, it may indicate a bearish trend and potential selling opportunities.
By combining these techniques with other technical analysis tools and market knowledge, traders can gain a deeper understanding of the market and make more informed trading decisions.
Trading strategies using Ichimoku Cloud on USDJPY
Now that we have an understanding of how the Ichimoku Cloud works, here are three trading strategies that traders can use to trade USD/JPY:
Strategy 1: Tenkan-sen/Kijun-sen crossover
- Entry: Buy when Tenkan-sen crosses above Kijun-sen and sell when Tenkan-sen crosses below Kijun-sen
- Stop loss: Set stop loss below the Kijun-sen
- Take profit: Take profit when the price reaches the Senkou Span B level
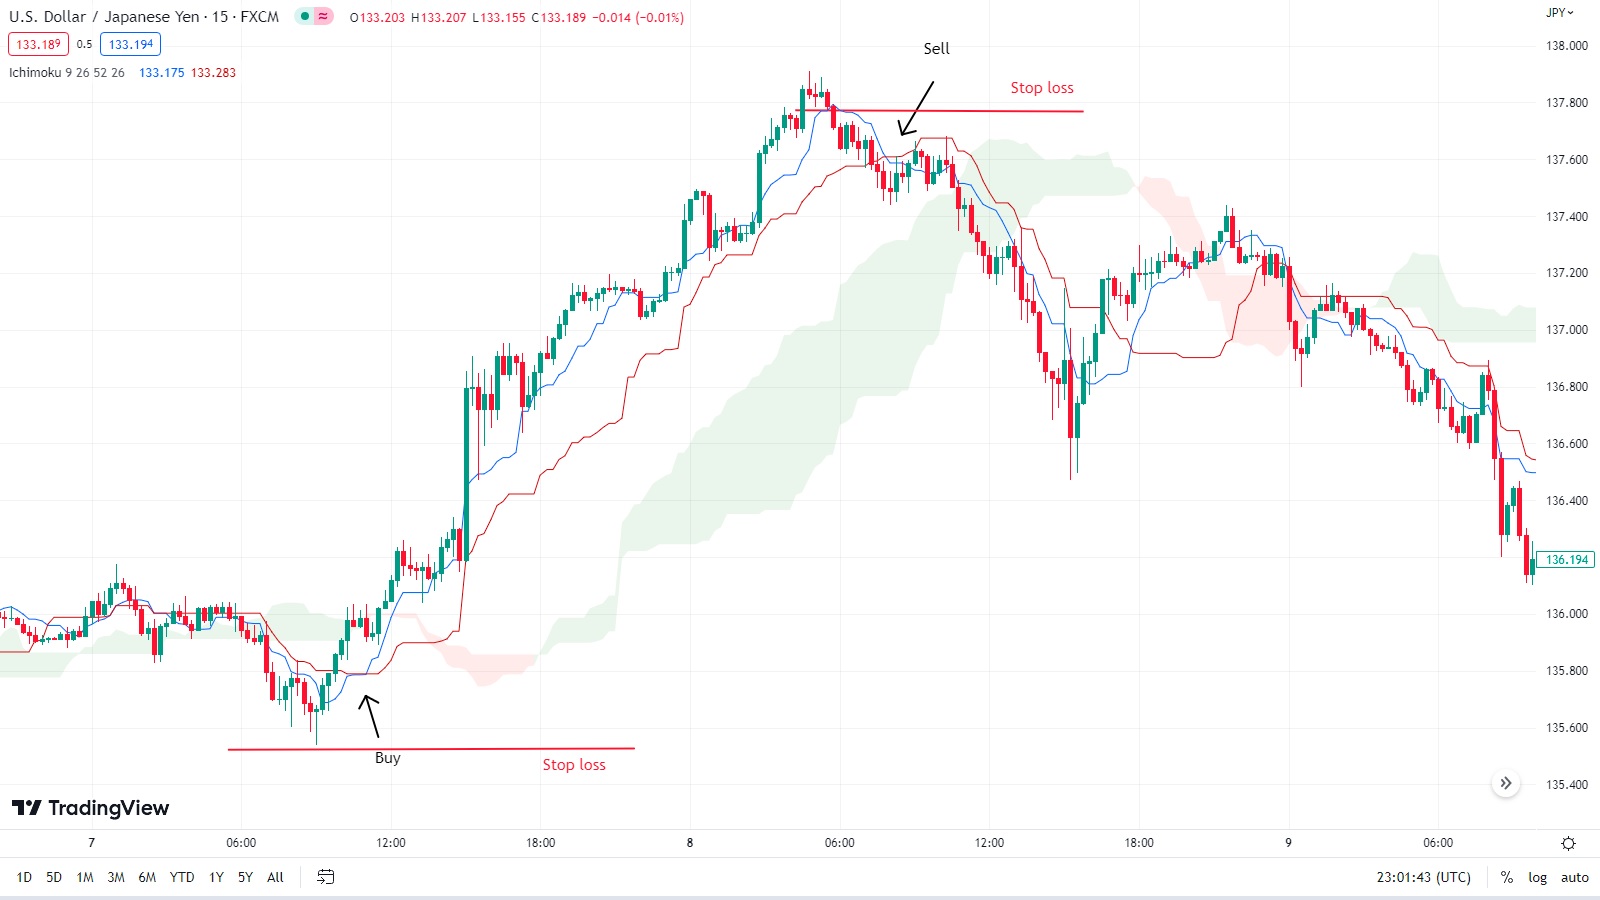
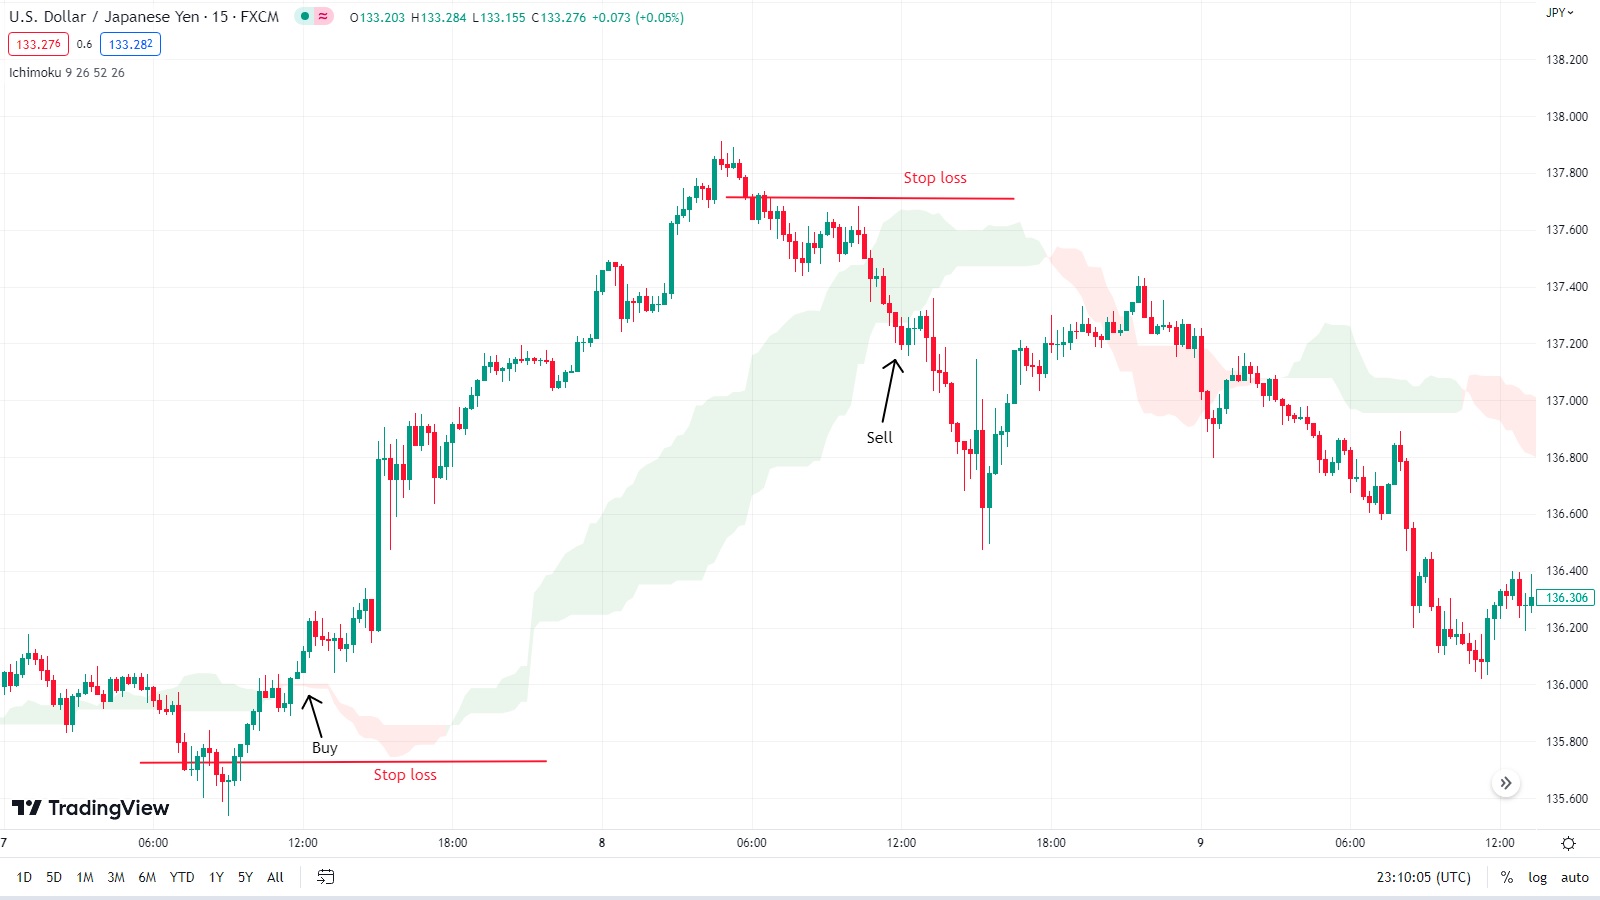
- Entry: Buy when the price breaks above the Kumo cloud and sell when the price breaks below the Kumo cloud
- Stop loss: Set stop loss below the Kumo cloud for long positions and above the Kumo cloud for short positions
- Take profit: Take profit when the price reaches the opposite side of the Kumo cloud
- Entry: Buy when the Chikou Span crosses above the price and sell when the Chikou Span crosses below the price
- Stop loss: Set stop loss below the Kijun-sen for long positions and above the Kijun-sen for short positions
- Take profit: Take profit when the price reaches the Senkou Span B level
- Ability to identify trends and support/resistance levels
- Provides clear signals for entry and exit points
- Can be complex for beginners to understand and use effectively
- May not be as effective in range-bound markets where there is little trend direction
- The Ichimoku Cloud consists of several components that work together to provide a comprehensive analysis of price action
- Traders can use the Ichimoku Cloud to identify trend direction and potential support/resistance levels
- Several trading strategies, including Tenkan-sen/Kijun-sen crossover, Kumo breakout, and Chikou Span confirmation, can be used with the Ichimoku Cloud to generate entry and exit signals
- It is important to consider both the advantages and disadvantages of using the Ichimoku Cloud, and to use proper risk management techniques when setting stop loss and take profit levels
- What is the Ichimoku Cloud?
The Ichimoku Cloud is a technical analysis tool used to identify trends and potential buy/sell signals in financial markets. - How is the Ichimoku Cloud calculated?
The Ichimoku Cloud is made up of several components, including the Tenkan-sen, Kijun-sen, Senkou Span A and B, and Chikou Span. These components are calculated using a combination of high, low, and closing prices over a specified period of time. - Is the Ichimoku Cloud suitable for beginner traders?
While the Ichimoku Cloud can be a powerful tool for experienced traders, it may be complex and difficult for beginners to understand and use effectively. It is recommended that traders take the time to learn and practice using the Ichimoku Cloud before incorporating it into their trading strategies. - What are some common trading strategies used with the Ichimoku Cloud?
Some common trading strategies used with the Ichimoku Cloud include Tenkan-sen/Kijun-sen crossovers, Kumo breakouts, and Chikou Span confirmations. These strategies can be used to generate entry and exit signals based on the movements of the Ichimoku Cloud components. - What are the advantages of using the Ichimoku Cloud in USD/JPY trading?
The Ichimoku Cloud can help traders identify trends and potential support/resistance levels, and can provide clear signals for entry and exit points. - What are the disadvantages of using the Ichimoku Cloud in USD/JPY trading?
The Ichimoku Cloud may not be effective in range-bound markets, and may be too complex for some traders to use effectively. - How can I incorporate risk management when using the Ichimoku Cloud?
Traders should always use proper risk management techniques when setting stop loss and take profit levels, and should consider the risk-reward ratio of each trade before entering.
Strategy 2: Kumo breakout
Strategy 3: Chikou Span confirmation
It's important to note that no trading strategy is foolproof and traders should always use risk management techniques such as setting stop losses and taking profits at appropriate levels. By combining the Ichimoku Cloud with other technical indicators and market knowledge, traders can create a well-rounded trading plan.
Advantages and disadvantages of using Ichimoku Cloud in USDJPY trading
While the Ichimoku Cloud can be a useful tool for trading USD/JPY, there are both advantages and disadvantages to consider:
Advantages:
Disadvantages:
Ultimately, whether or not to use the Ichimoku Cloud in USD/JPY trading depends on the individual trader's experience and preferences. Traders should always consider the risks involved and use proper risk management techniques when implementing trading strategies.
Conclusion
In conclusion, the Ichimoku Cloud is a powerful technical analysis tool that can be used to analyze USD/JPY trading trends and potential buy/sell signals. Key takeaways include:
While the Ichimoku Cloud can be complex and may not be suitable for all traders, those who take the time to understand and use it properly may find it to be a valuable tool in their USD/JPY trading strategy.
Frequently Asked Questions
Our Recommended Brokers
© Copyright 2022 - Tradinsights. All Rights Reserved. Published by Tradinsights.