Introduction
Heikin Ashi charts are a type of candlestick chart that can be used to analyze market trends and make trading decisions. Unlike traditional candlestick charts, Heikin Ashi charts use modified candlesticks that take into account the price movement of the previous candlestick. This can help traders get a more accurate view of the trend and potential reversals.
Support and resistance levels are important concepts in trading that can help traders identify potential entry and exit points. Support levels represent areas where buyers are willing to step in and prevent the price from falling further, while resistance levels represent areas where sellers are willing to step in and prevent the price from rising higher. Understanding these levels can be crucial for making informed trading decisions.
In this article, we will explore how Heikin Ashi charts can be used for support and resistance trading. We will discuss how to identify support and resistance levels on a Heikin Ashi chart, trading strategies for support and resistance trading using Heikin Ashi charts, and tips for successful trading. By the end of this article, you will have a better understanding of how to use Heikin Ashi charts for support and resistance trading in your own trading strategy.
Understanding Support and Resistance Levels
What are Support and Resistance Levels?
Support and resistance levels are price levels on a chart where the market has previously had difficulty moving beyond. Support levels are where buying pressure enters the market, preventing the price from falling further, while resistance levels are where selling pressure enters the market, preventing the price from rising higher.
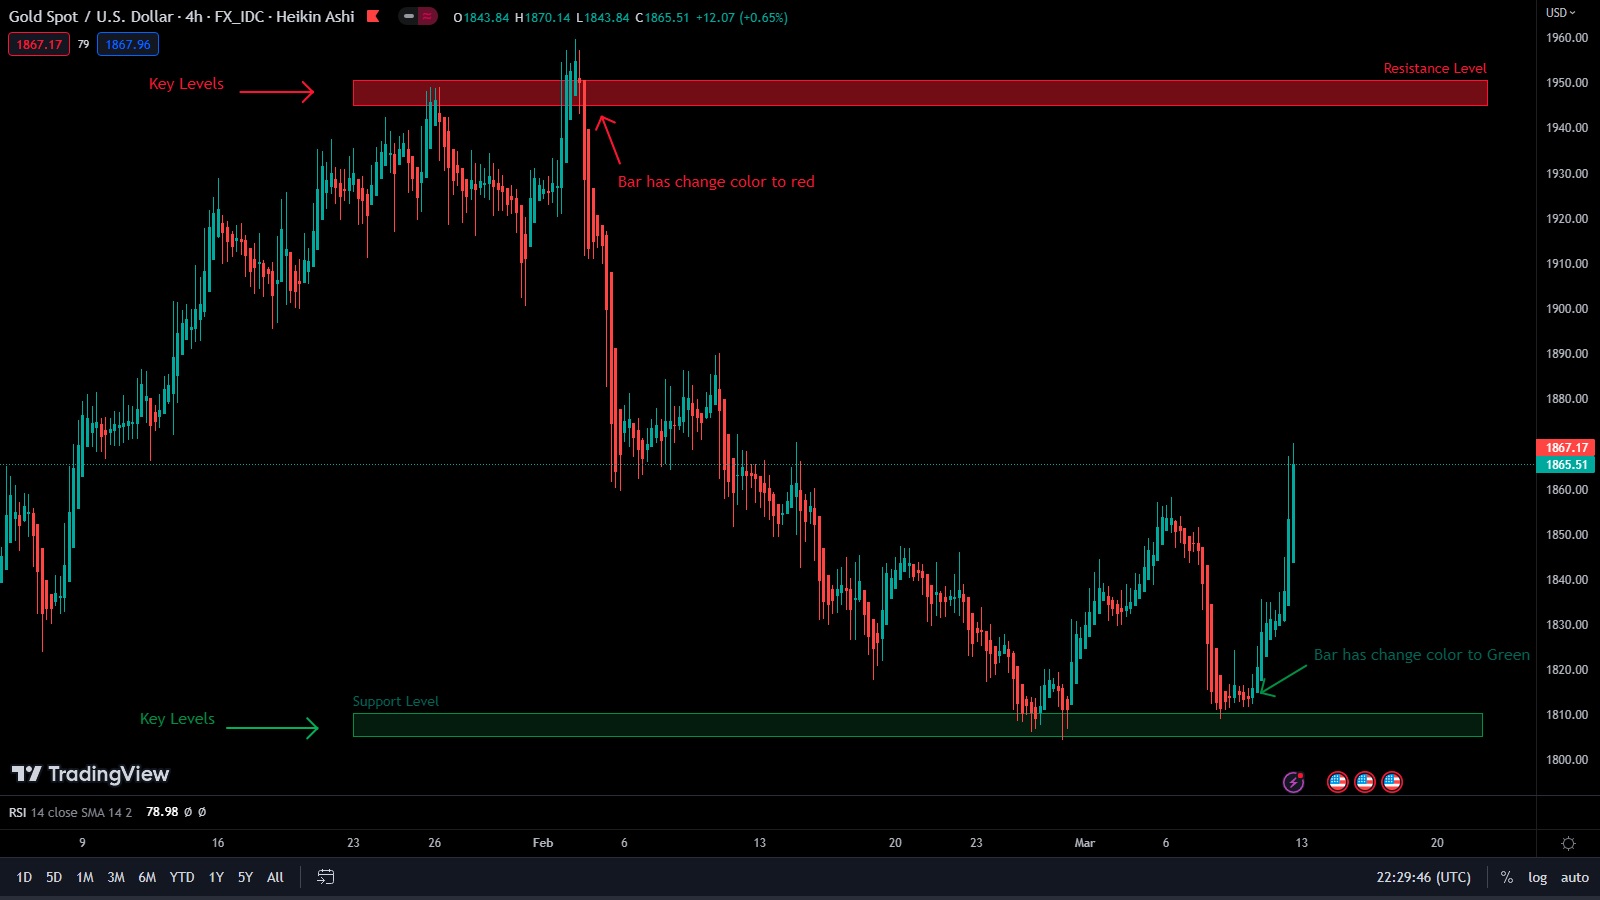
Identifying Support and Resistance Levels on Heikin Ashi Charts
On a Heikin Ashi chart, support and resistance levels can be identified by connecting the highs or lows of multiple candlesticks. These levels appear as horizontal lines on the chart and can also be confirmed using technical indicators like moving averages or Bollinger Bands.
Why Support and Resistance Levels are Important in Trading Decisions
Support and resistance levels can be powerful tools for traders, as they can indicate potential trend reversals and help identify key entry and exit points. By paying attention to these levels, traders can improve their chances of making profitable trades and managing risk effectively.
Heikin Ashi Charting for Support and Resistance Trading
Heikin Ashi charts are a type of candlestick chart that use a modified formula to calculate price movements, which can provide traders with a clearer picture of market trends and price action. When used for support and resistance trading, Heikin Ashi charts can help traders identify key levels more accurately and make more informed trading decisions.
How Heikin Ashi Charts Help Traders Identify Support and Resistance Levels More Accurately
Heikin Ashi charts smooth out the noise in price movements by using a modified formula that takes into account the previous candle's open, high, low, and close prices. This can help traders identify trends more easily and make it easier to spot potential support and resistance levels on the chart.
Comparison of Heikin Ashi Charts to Traditional Candlestick Charts for Support and Resistance Trading
While traditional candlestick charts can also be used for support and resistance trading, Heikin Ashi charts can provide traders with a clearer picture of market trends and price action. By smoothing out the noise in price movements, Heikin Ashi charts can help traders make more accurate trading decisions and improve their chances of success in the market.
Trading Strategies for Support and Resistance Trading with Heikin Ashi Charts
There are several key trading strategies that traders can use when trading support and resistance levels on Heikin Ashi charts, including breakout trading, bounce trading, and pullback trading. Each of these strategies involves using the Heikin Ashi chart to identify key levels and make trading decisions based on price action and other technical indicators.
Breakout Trading
Breakout trading involves identifying key support and resistance levels on the Heikin Ashi chart and placing a trade when the price breaks through one of these levels. Traders can use technical indicators like moving averages or Bollinger Bands to confirm a breakout and make more informed trading decisions.
Bounce Trading
Bounce trading involves placing trades when the price bounces off a key support or resistance level on the Heikin Ashi chart. Traders can use technical indicators like the Relative Strength Index (RSI) or Stochastic Oscillator to confirm a bounce and make more accurate trading decisions.
Pullback Trading
Pullback trading involves waiting for the price to pull back to a key support or resistance level on the Heikin Ashi chart before placing a trade in the direction of the overall trend. Traders can use technical indicators like the Moving Average Convergence Divergence (MACD) or Ichimoku Cloud to confirm a pullback and make more informed trading decisions.
Examples of Trades Using Heikin Ashi Charts for Support and Resistance Trading
Here are some examples of trades that traders could make using Heikin Ashi charts for support and resistance trading:
- A breakout trade when the price breaks through a key resistance level on the Heikin Ashi chart, confirmed by a rising RSI.
- A bounce trade when the price bounces off a key support level on the Heikin Ashi chart, confirmed by a bullish Stochastic Oscillator.
- A pullback trade when the price pulls back to a key support level on the Heikin Ashi chart, confirmed by a rising MACD and bullish Ichimoku Cloud.
Key Tips for Successful Support and Resistance Trading with Heikin Ashi Charts
While Heikin Ashi charts can be a powerful tool for support and resistance trading, it's important to keep in mind some key tips to increase the chances of success:
Using Multiple Time Frames
Using multiple time frames can help traders get a better sense of the overall trend and confirm signals on the Heikin Ashi chart. For example, a trader might use a daily chart to get a sense of the long-term trend, and a 4-hour chart to get a more detailed view of potential support and resistance levels.
Confirming Signals with Other Indicators or Chart Patterns
Traders can also use other technical indicators or chart patterns to confirm signals on the Heikin Ashi chart. For example, a trader might look for a trend line break or a Fibonacci retracement level to confirm a potential support or resistance level on the Heikin Ashi chart.
Proper Risk Management and Position Sizing
Finally, it's important for traders to practice proper risk management and position sizing when trading with Heikin Ashi charts. This means setting stop-loss orders to protect against potential losses, and only risking a small percentage of the trading account on each trade to minimize overall risk.
Conclusion
In this article, we've covered the following key points about Heikin Ashi charting for support and resistance trading:
- Support and resistance levels are important areas of the market where traders can look for potential buying or selling opportunities.
- Heikin Ashi charts can help traders identify support and resistance levels more accurately, thanks to their smoothing effect.
- Traders can use key trading strategies like breakout trading, bounce trading, and pullback trading to take advantage of potential support and resistance levels on the Heikin Ashi chart.
- Using multiple time frames, confirming signals with other indicators or chart patterns, and practicing proper risk management and position sizing are all important factors for successful support and resistance trading with Heikin Ashi charts.
Overall, Heikin Ashi charting can be a valuable tool for traders looking to identify potential support and resistance levels in the market. By smoothing out the traditional candlestick chart, Heikin Ashi charts can help traders see the overall trend more clearly and make more informed trading decisions.
If you're interested in trying out Heikin Ashi charts in your trading strategy, we encourage you to start by experimenting with different time frames and trading strategies. Remember to always practice proper risk management and position sizing to protect your trading account.
FAQ
Q: What is a Heikin Ashi chart?
A: A Heikin Ashi chart is a type of candlestick chart that uses a modified formula to calculate each candle's open, close, high, and low prices. The resulting chart is smoother than a traditional candlestick chart and can help traders identify trends more easily.
Q: How do I identify support and resistance levels on a Heikin Ashi chart?
A: To identify support and resistance levels on a Heikin Ashi chart, look for areas where the price has previously reversed or stalled. These areas can be identified as "wicks" or "shadows" on the chart.
Q: How does Heikin Ashi charting differ from traditional candlestick charting?
A: Heikin Ashi charting differs from traditional candlestick charting in that it uses a modified formula to calculate each candle's open, close, high, and low prices. The resulting chart is smoother and can help traders identify trends more easily.
Q: What trading strategies can I use with Heikin Ashi charts?
A: Traders can use various trading strategies such as breakout trading, bounce trading, and pullback trading to benefit from potential support and resistance levels on the Heikin Ashi chart.
Q: How can I confirm trading signals on a Heikin Ashi chart?
A: Traders can confirm trading signals on a Heikin Ashi chart by using other technical indicators or chart patterns, such as moving averages or trendlines.
Q: How can I practice proper risk management and position sizing when trading with Heikin Ashi charts?
A: To practice proper risk management and position sizing when trading with Heikin Ashi charts, traders should determine their maximum risk per trade and adjust their position size accordingly. They should also use stop-loss orders to limit their potential losses.
Our Recommended Brokers
© Copyright 2022 - Tradinsights. All Rights Reserved. Published by Tradinsights.